

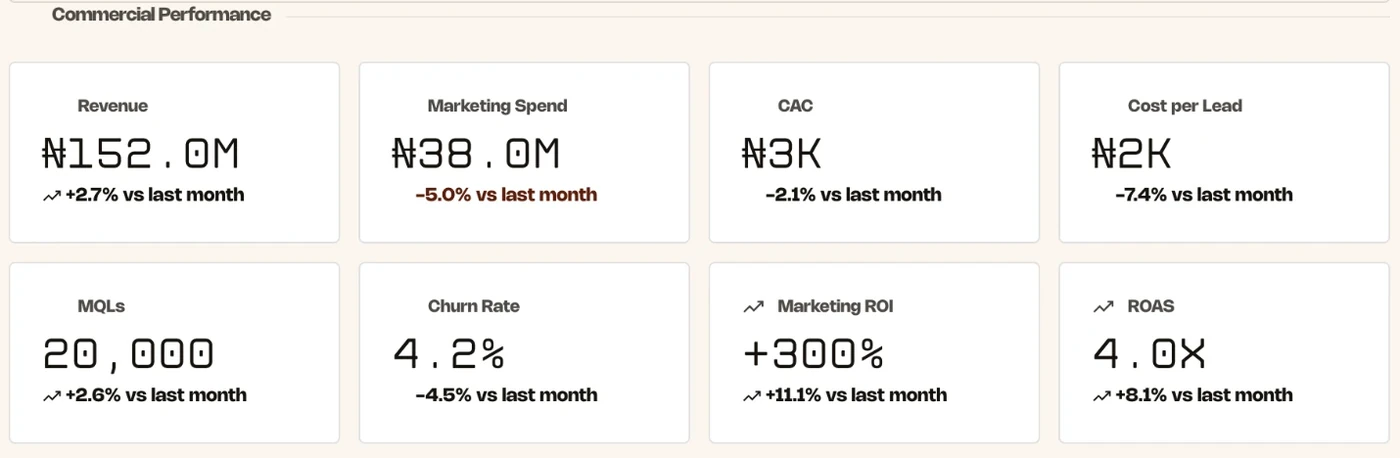
Marketing you can defend in money
Revenue, spend, CAC, ROI and ROAS on one row, pulled from Meta Ads, GA4, Paystack and your site pixel. Every figure carries its change since last month, so the budget conversation starts with evidence.
Brand intelligence that reads your market in its own language


Your customers are talking about you in Pidgin, Yoruba, Igbo and Hausa. BrandGauge hears all of it and hands you one number you can defend in a budget meeting.
A minute through the whole product: what the market is saying about your brand, what your spend moved, and the page you hand your MD.
Inside BrandGauge
One page tells you where the brand stands, what moved it last week, and what it cost to move. No exports, no chasing four dashboards before a 10am meeting.
Revenue, spend, CAC, ROI and ROAS on one row, pulled from Meta Ads, GA4, Paystack and your site pixel. Every figure carries its change since last month, so the budget conversation starts with evidence.
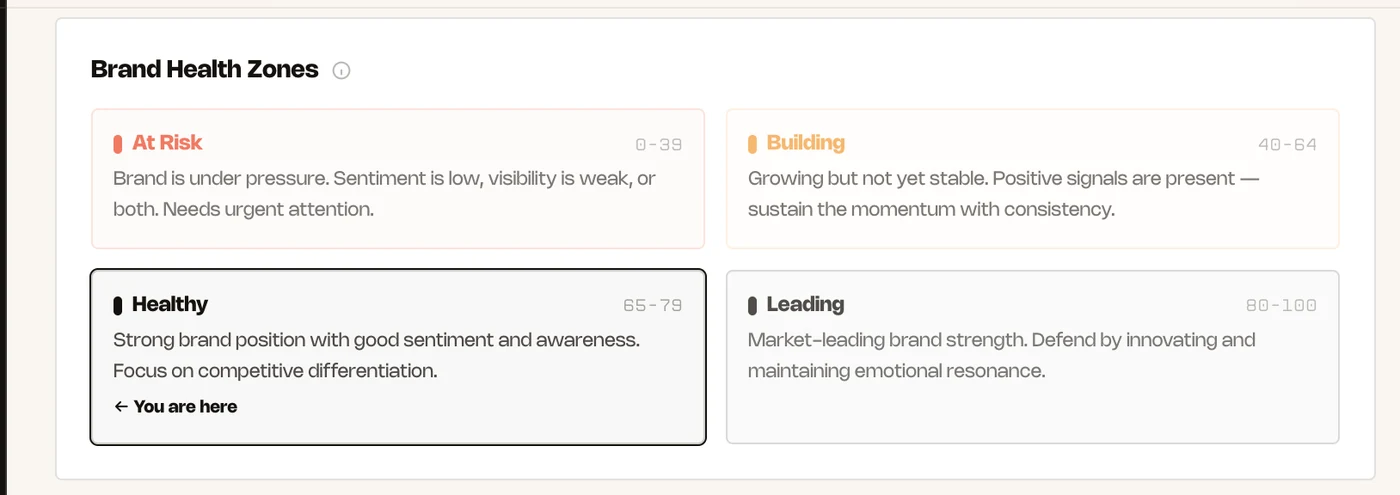
Five signals weighted for your industry, landing in one of four zones. The score tells you where you are. The zone tells you what to do about it.
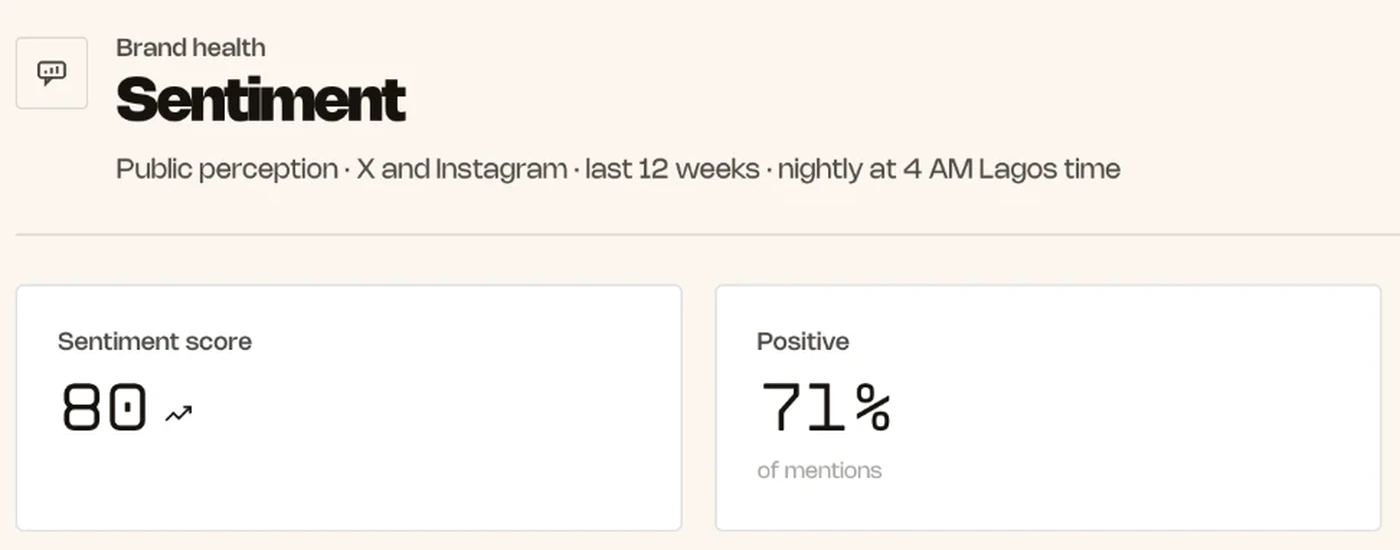
Pidgin, Yoruba, Igbo and Hausa read the way a Lagos marketer would read them, across X and Instagram, refreshed nightly at 4 AM Lagos time.
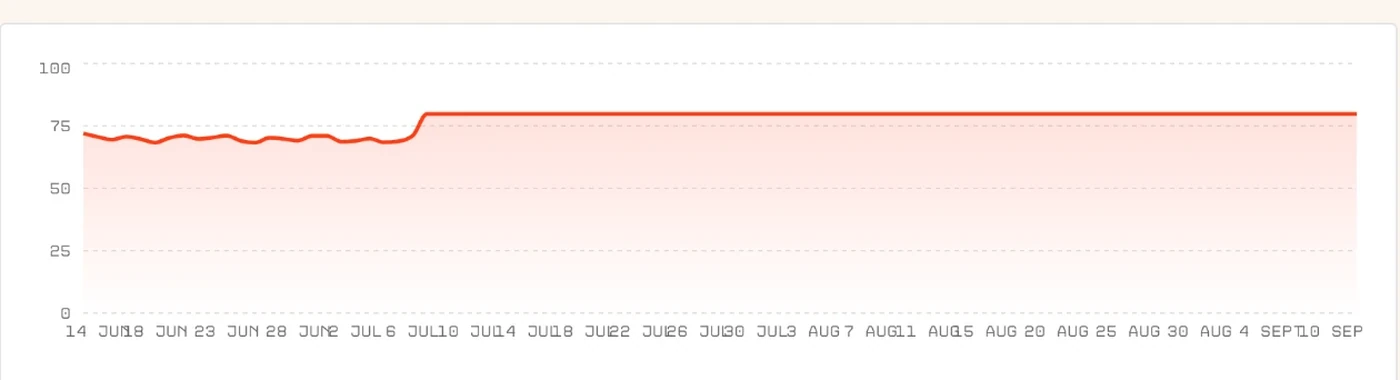
The index plotted daily, so a campaign, a crisis or a price change shows up as a shape you can point at in a meeting.

Your position, your blind spots and the two things to fix this week, written from live connector data and named competitors. Not a chart you have to interpret. A paragraph you can forward.
A billboard on the expressway, a market stall in Oshodi, a junction full of danfos. BrandGauge ties a vanity link and a UTM to each one, so the board sees what the outdoor spend actually returned.



Why BrandGauge
Sentiment models that understand Pidgin, Yoruba, Igbo and Hausa, tuned on how customers here actually talk about brands. Global tools guess. This one knows.
Ambassadors capture leads at events through a phone-first app. Field officers log store visits. It all lands on the same dashboard as your ads.
Billboards, radio, TV and print get vanity links, geo attribution and AI media-plan analysis. The biggest slice of your budget stops being a blind spot.
CAC, ROI, funnel lift and an AI-written business case, generated from live connector data. Walk into the budget meeting with proof.
A weekly check on what ChatGPT, Gemini and Perplexity say when customers ask about your category. A channel your competitors ignore.
FMCG, fintech, venues, B2B SaaS, marketplaces, beverages and distribution. The index, funnel and recommendations reshape for each.
4
languages read natively
7
industry playbooks
10+
live connectors
5
offline channels measured
Plain questions, straight answers, sourced from your own numbers. And once a week, BrandGauge asks the big AI assistants about your category. It scores how you show up.
Negative spike traces to a 14-hour app outage on Tuesday.
62% of negative mentions were in Hausa. Top phrase: "ba ya aiki" (it is not working).
Recommend: service-status notice to northern segments + in-app banner.
How AI answers about your brand
Weekly checkChatGPT
82
Gemini
74
Perplexity
68
Pick your industry once. The score, the funnel signals and the connectors it asks you for all reweight around how your business actually makes money. Tap through and watch what changes.
What the index leans onShelf visibility, share of voice, distributor pull

FMCG
Free, no account
Name your brand and three rivals. We read thirty days of Punch, Vanguard, BusinessDay, Nairametrics, TechCabal and five more, weight every story by how many people read that outlet, and tell you your share of the earned reach in your category and what it would have cost to buy. Nothing to connect. Nothing of yours goes anywhere.
Free while in beta. Connect a social account and see your first Brand Health Index in minutes.